Linking the Signaling Cascades and Dynamic Regulatory Networks Controlling Stress Responses
Short osmotic stress model
The images below show a network view of which TFs are active at each time point in the short osmotic stress model. Green nodes are TFs, red nodes are sources, and blue nodes are other predicted osmotic stress pathway members. The images correspond to the regulatory path splits at 0, 2, 4, 6, and 8 minutes.
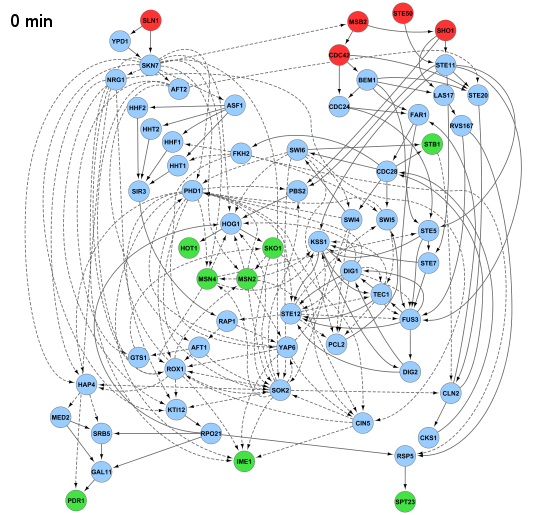
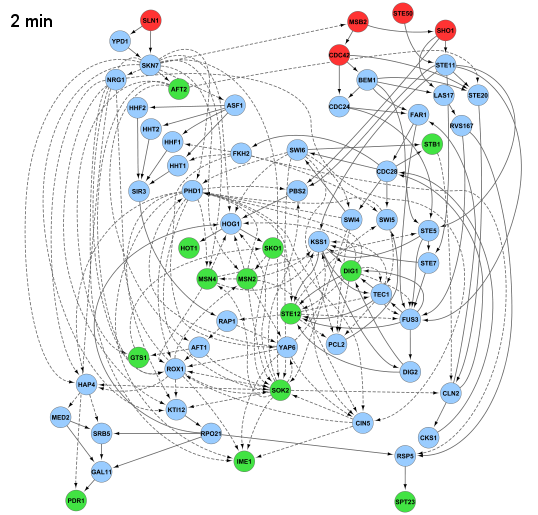
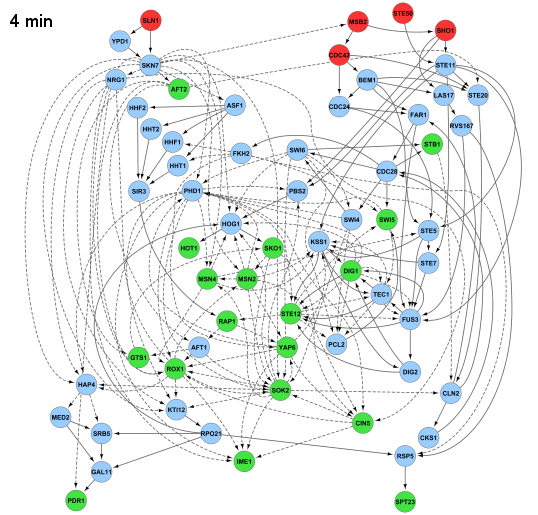
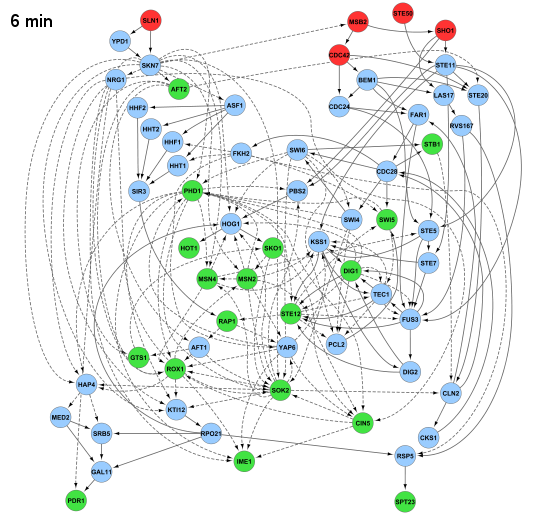
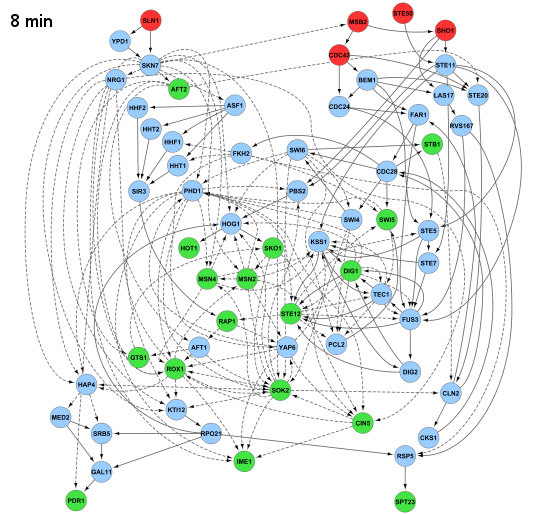
The Cytoscape network files used to generate the above figures and the short osmotic stress model network in the main text are available here. The *.noa files describe which TFs are active and shortHog.sif specifies the protein-protein and protein-DNA interactions.
Long osmotic stress model
The images below show a network view of which TFs are active at each time point in the long osmotic stress model. The images correspond to the regulatory path splits at 0, 5, 15, 30, and 45 minutes.
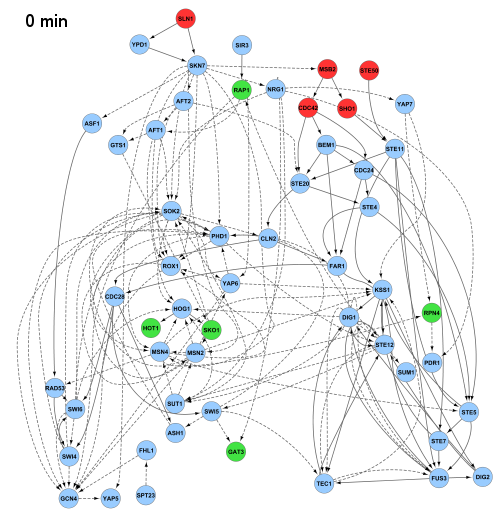
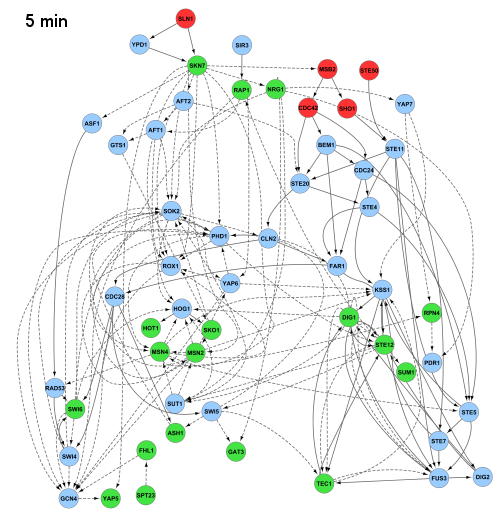
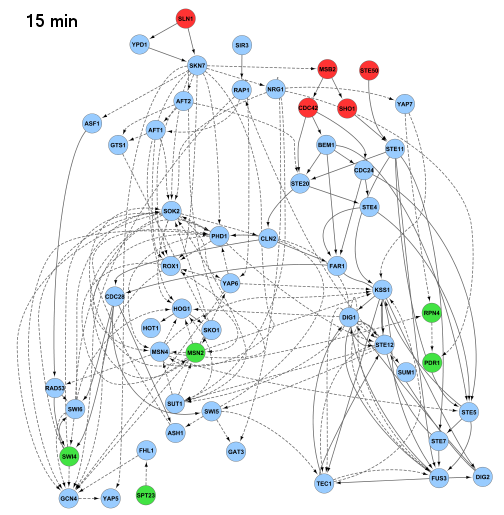
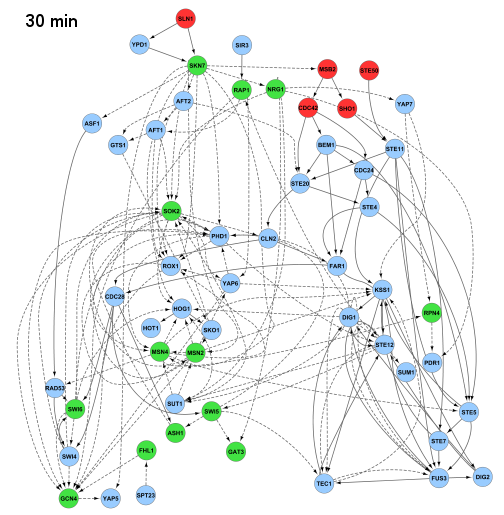
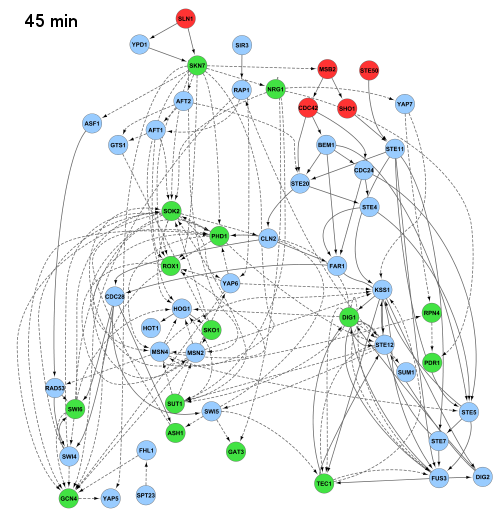
The Cytoscape network files used to generate the above figures and the long osmotic stress model network in the main text are available here.
TOR model
The images below show a network view of which TFs are active at each time point in the TOR model. The images correspond to the regulatory path splits at 0, 20, 30, 60, and 90 minutes.
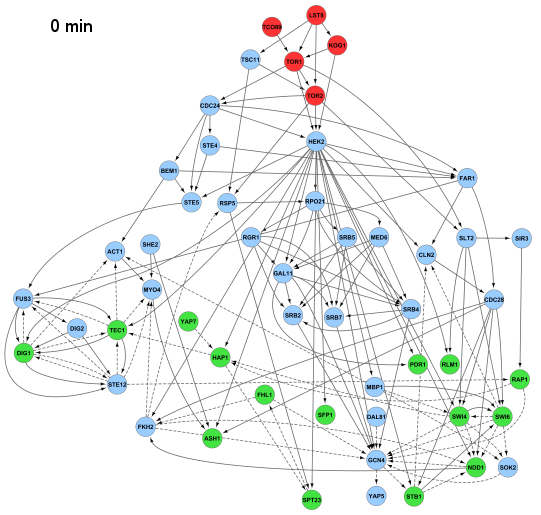
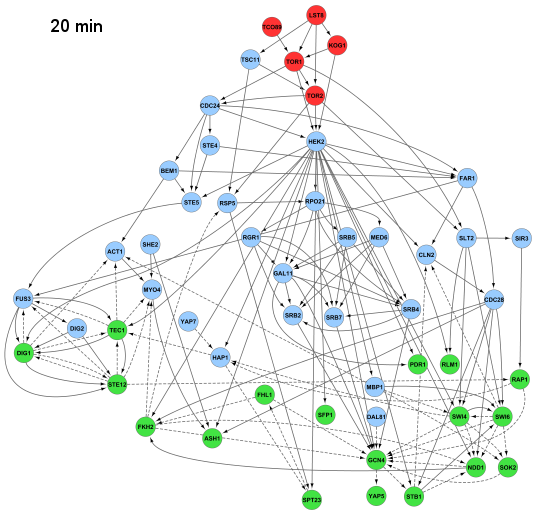
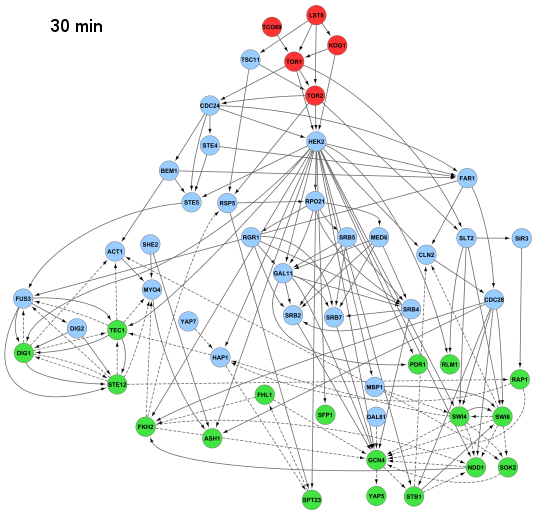
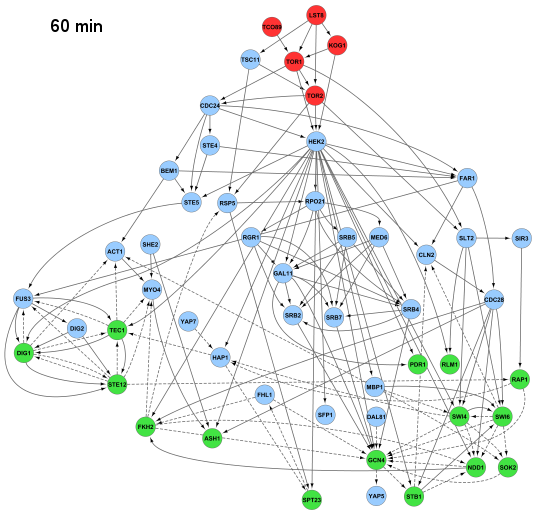
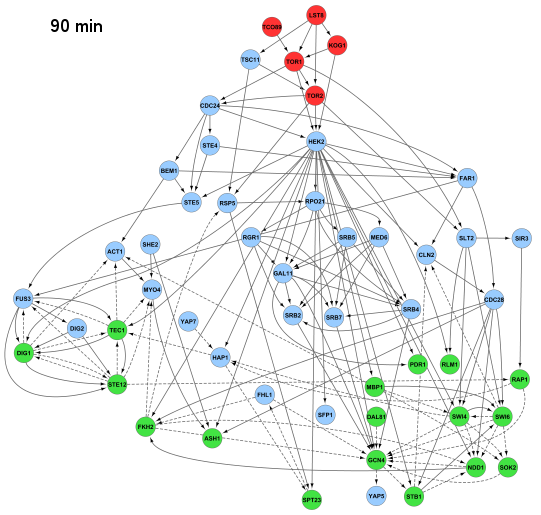
The Cytoscape network files used to generate the above figures and the TOR model network in the Supplementary Results are available here.
Back to main page


