SDREM: Signaling and Dynamic Regulatory Events Miner
Color figures from SDREM book chapter
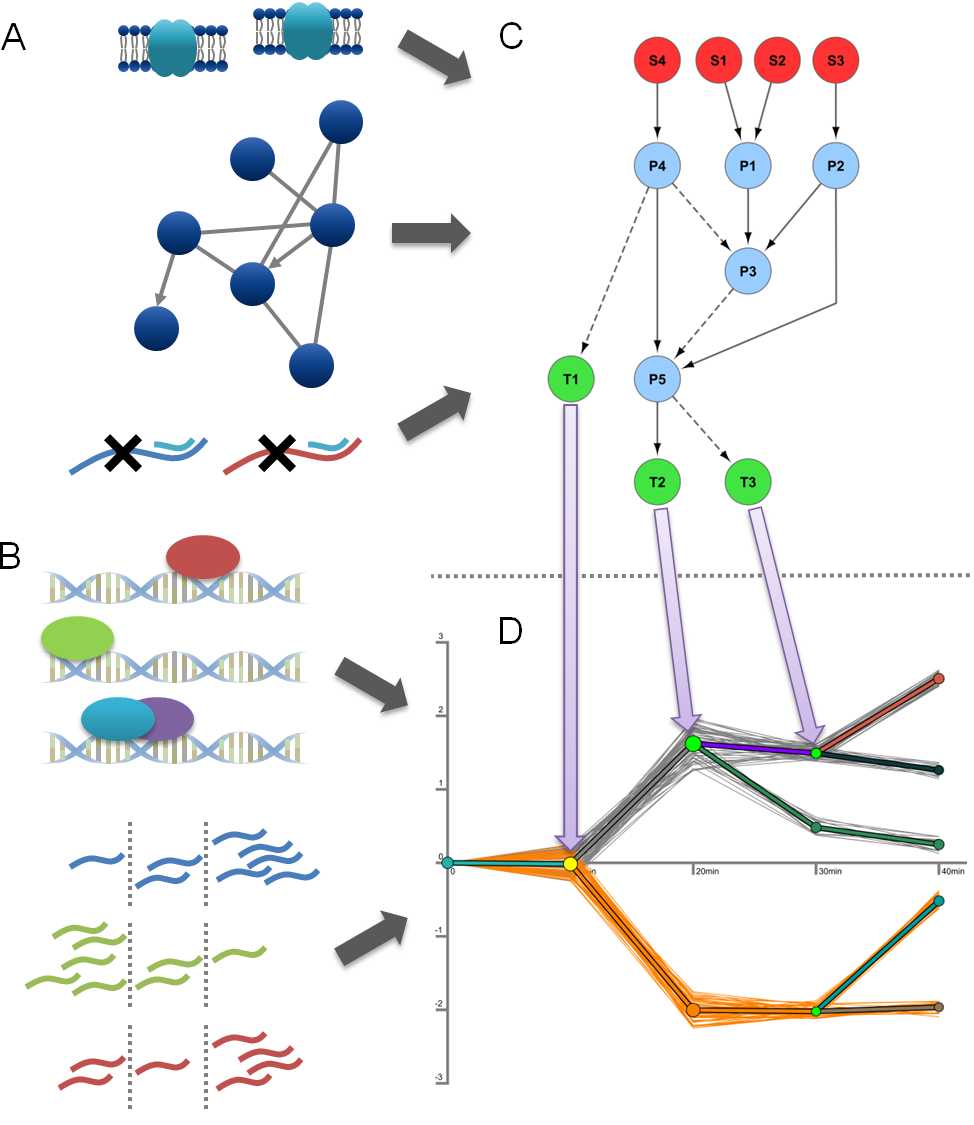
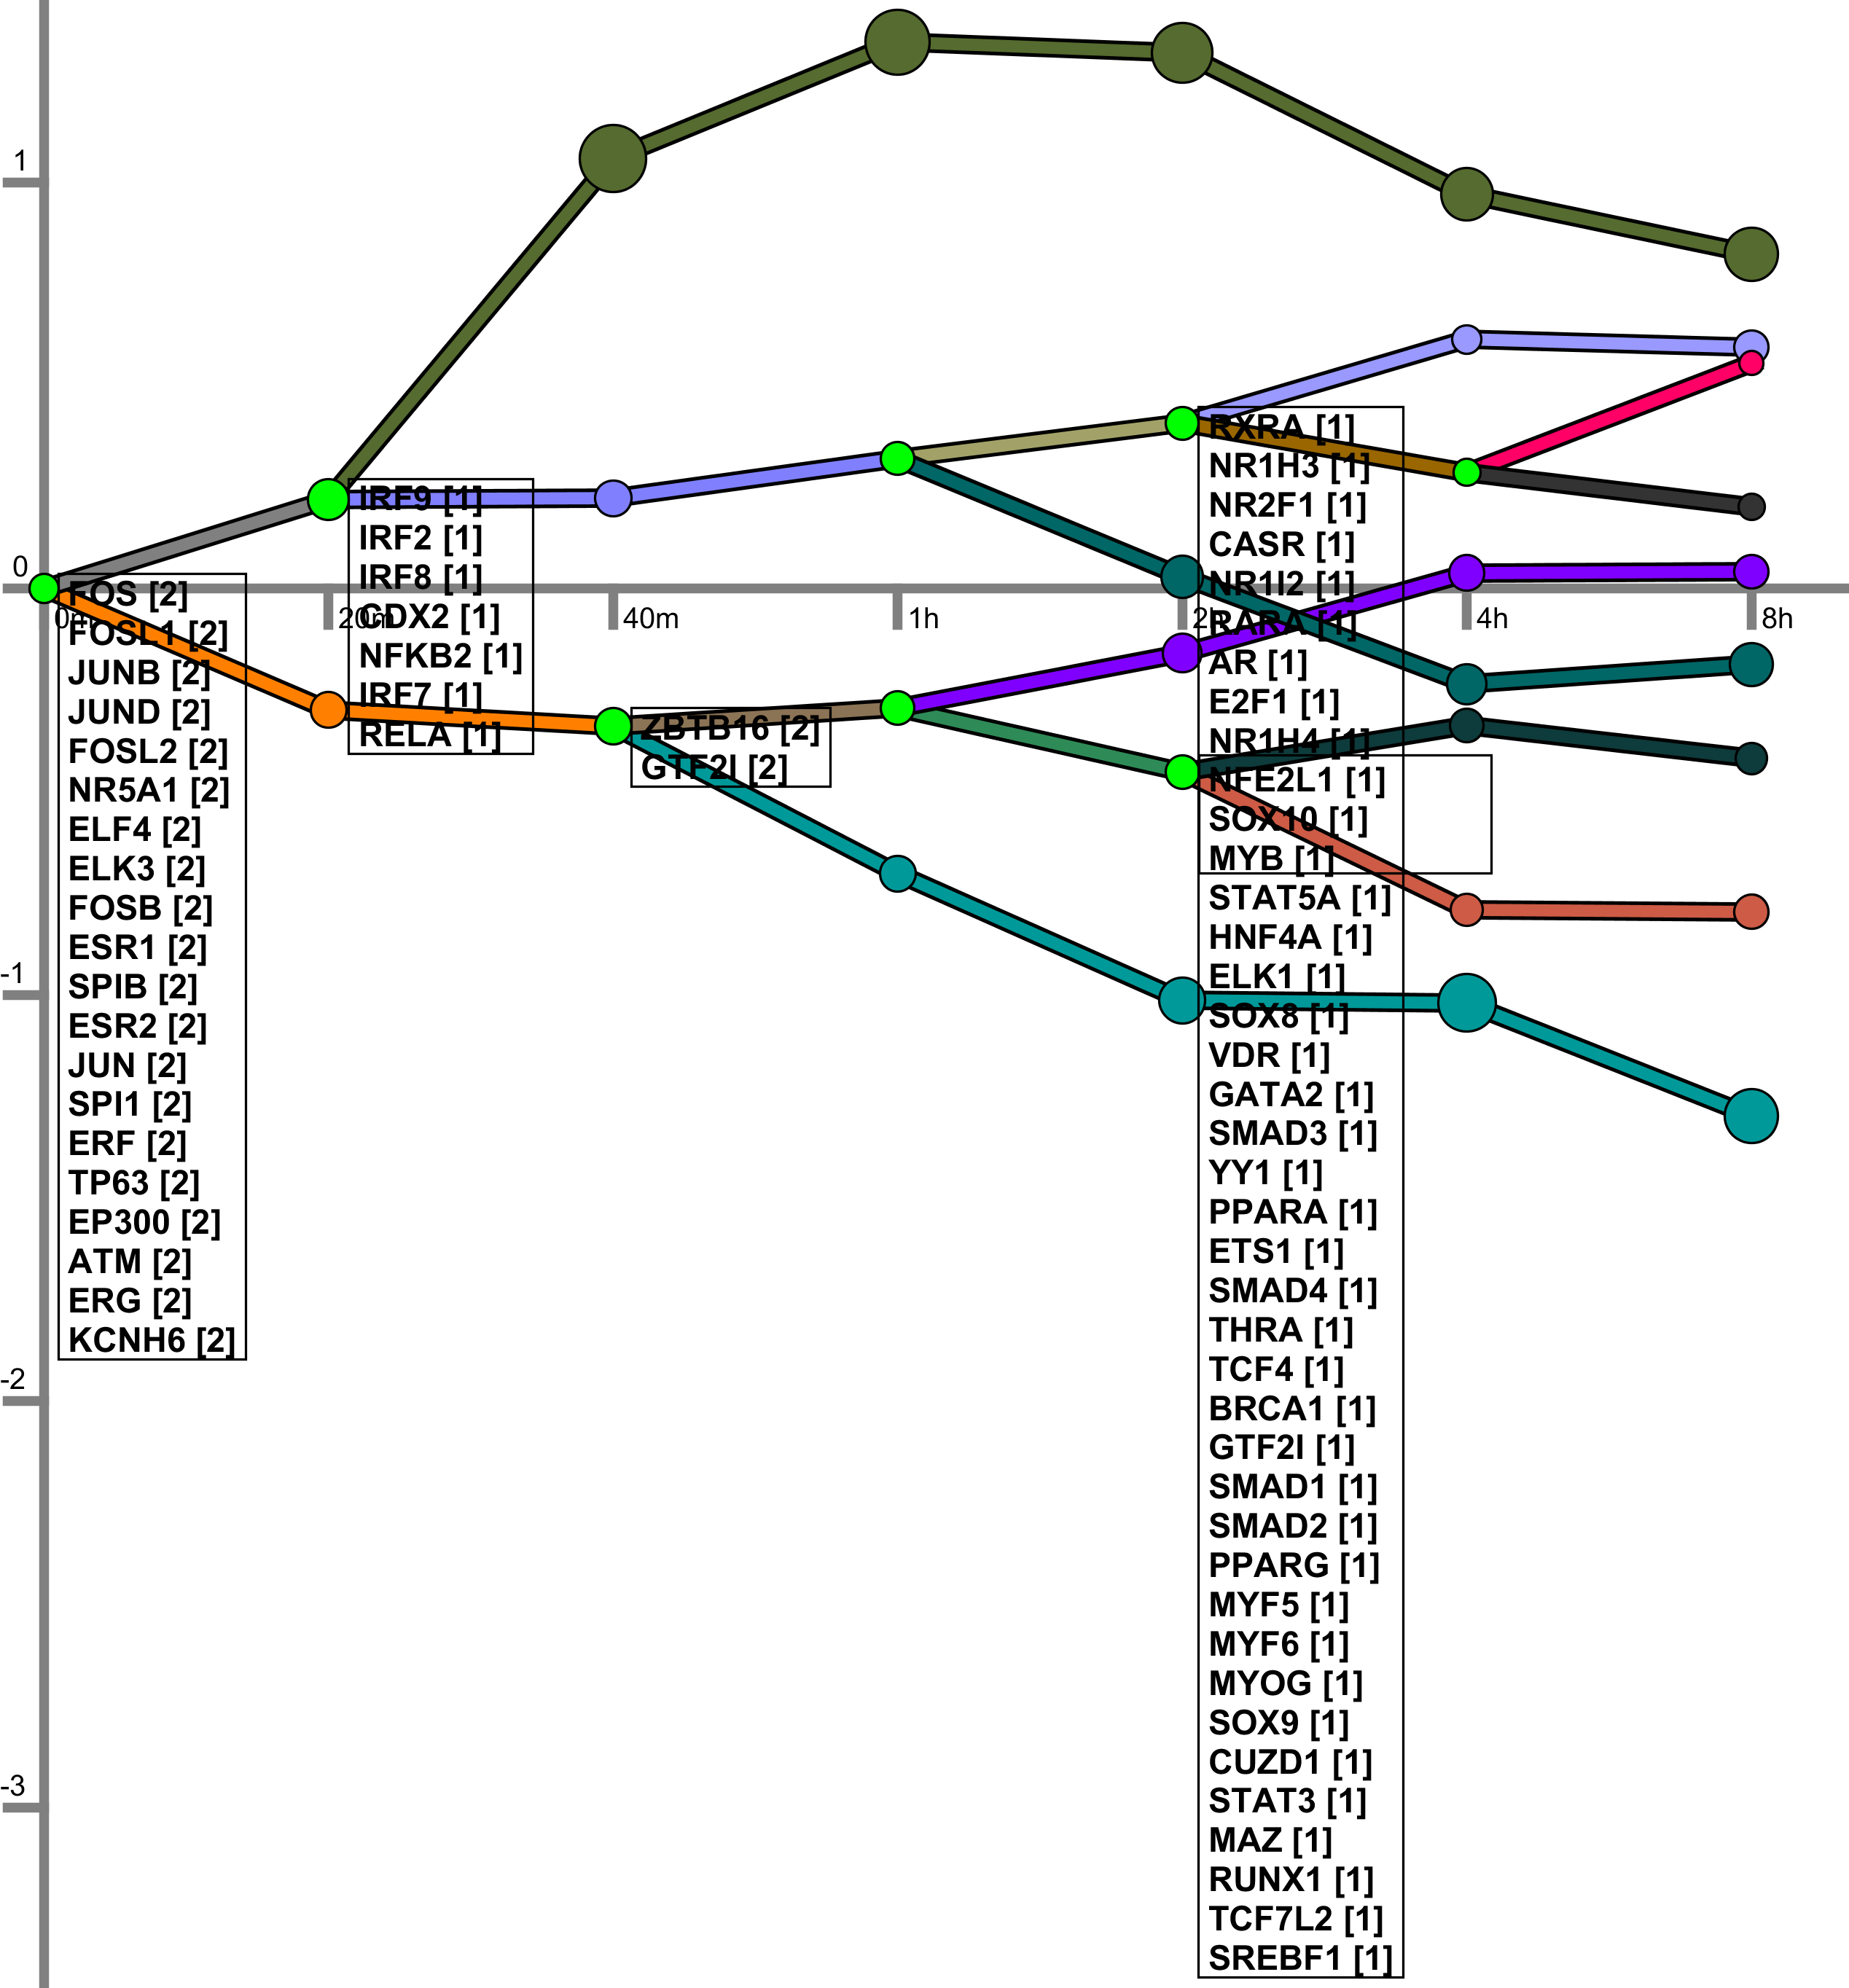
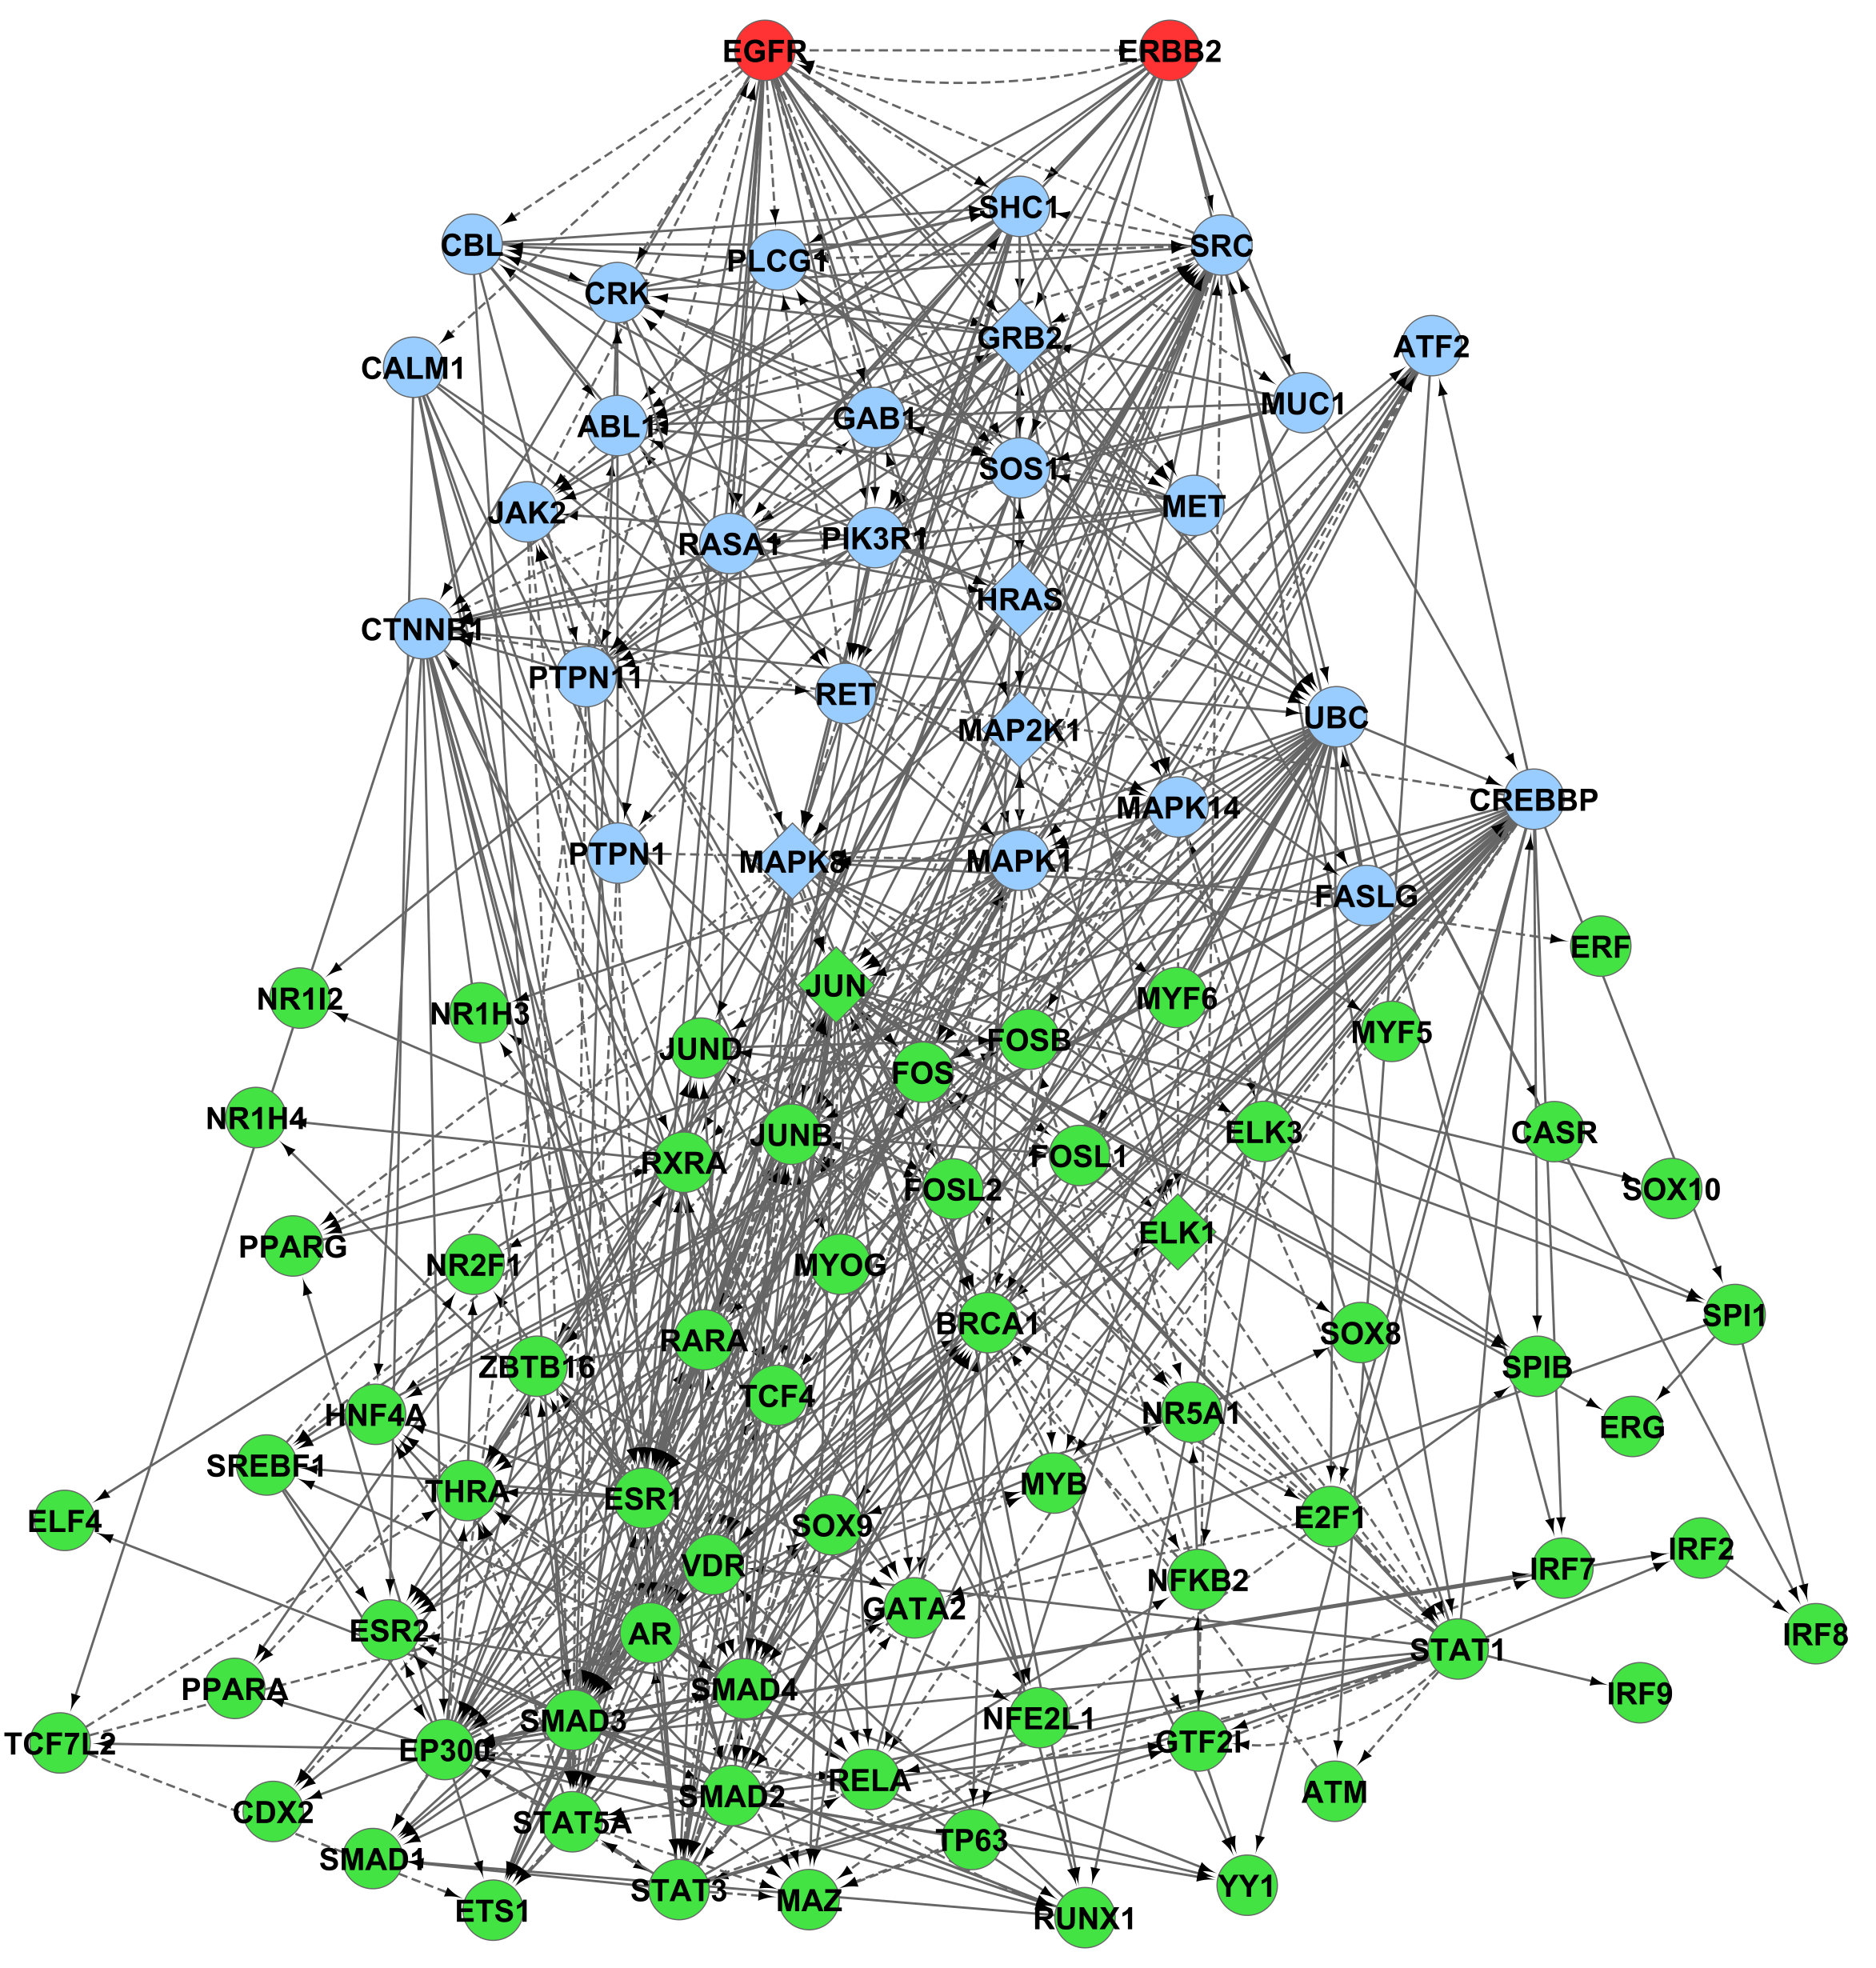
The print version of the SDREM book chapter The SDREM method for reconstructing signaling and regulatory response networks: Applications for studying disease progression contains grayscale versions of the following figures. Please contact Anthony Gitter for a copy of the chapter PDF if you are unable to access it.


These figures were generated using SDREM version 1.2 and the example data packaged with it. All default settings were used except Minimum_Absolute_Log_Ratio_Expression=0.5 and Maximum_number_of_paths_out_of_split=3 in the DREM properties file.
Back to main page


