Discovering Pathways by Orienting Edges in Protein Interaction Networks
Pathway predictions
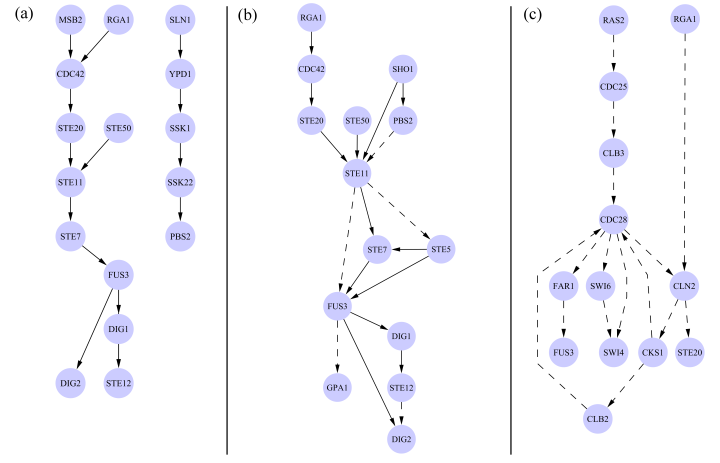
The figure below shows a few of the top ranked pathways discovered by the random orientation + local search algorithm. All predicted paths contained 5 or fewer edges, thus the figure depicts the union of multiple individual paths. Panel (a) contains predictions that perfectly match subsets of a known gold standard pathway. Panel (b) shows paths that partially match the gold standard paths. Panel (c) illustrates predictions that were not present in the gold standard. However a literature search revealed that the direction assigned to these edges is biologically reasonable based on their utilization in the cell cycle (see the paper for details). All solid edges represent edges that are oriented correctly according to the gold standard, and dashed lines either disagree with the gold standard orientation or are not present in the gold standard. Validation of many of the dashed lines can be found in the paper.

The top ranked pathways from which the above figure was derived can be downloaded here.
The files used to generate the figure in Cytoscape are available here.
An example of an oriented network produced by the random orientation + local search algorithm is available here. This file contains only the 2453 directed edges that are on a path with 5 or fewer edges in the oriented network. The algorithm was run using the same data and settings as the evaluation summarized in Table 2 of the paper. However, the data here is from a separate run of this nondeterministic algorithm. Therefore, some orientations may differ from those analyzed in the paper or shown above.
Back to main page

